Intepreting Results
After a successful ORBITM run, you would expect two output text files in the main directory, and three Matplotlib figures.
The first text file “output_summary.txt” is a summary of the lifetime (i.e. how long the spacecraft can last without orbit maintenance).
Lifetime decay is estimated to be on 13 May 2027 16:54:31.252 after 29940 orbits.
The lifetime is 5.4 years.
The total impulse needed: 2233.4388819714236
The total Delta-V (m/s) needed is 13.137875776302492
The second text file “output_manoeuvres.txt” is an estimate of the orbit maintenance manoeuvre schedule.
1 Maintain.Hohmann 2022-03-01 11:40:00 2.1896281088566925
2 Maintain.Hohmann 2022-04-29 12:07:49 2.1896767040214486
3 Maintain.Hohmann 2022-06-27 12:35:38 2.1896387651453866
4 Maintain.Hohmann 2022-08-25 13:03:27 2.189679576264574
5 Maintain.Hohmann 2022-10-23 13:31:16 2.1896504433114723
6 Maintain.Hohmann 2022-12-21 13:59:05 2.1896153519034436
To interpret the graphical results, let us run a simple orbit maintenance scenario for a satellite in a 550km altitude circular orbit at 45 degrees inclination.
The plots in blue correspond to “Sam’s Simulator”. The plots in orange correspond to using STK 10 Astrogator, with a high precision orbit propagator, and it uses Astrogator’s Automatic Sequences feature to boost the orbit up whenever the altitude of the spacecraft crosses the minimum of the maintenance tolerance band. In both orbit maintenance modes, the ΔV values were computed using a first order Taylor expansion to the Vis-Visa equation.
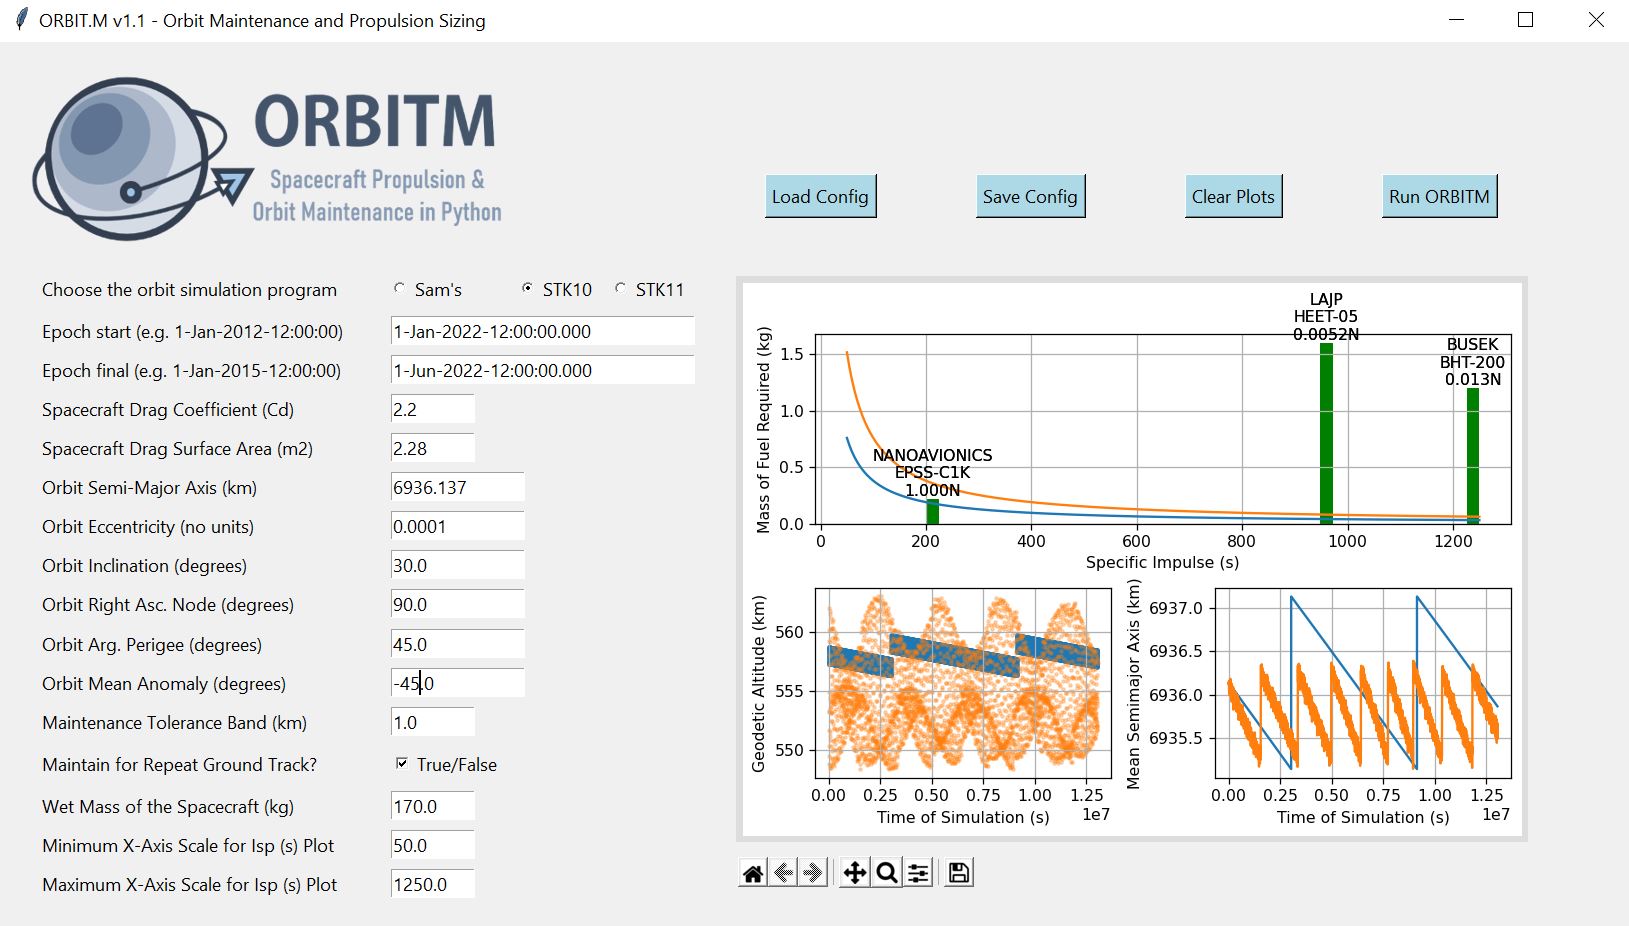
Figure 3.1 - Screenshot after running ORBITM, for a 550km orbit with a tolerance band of 1km
The plot most relevant to mission planning that you would need is the top-most plot - the profile of the mission lifetime (in terms of total ΔV requirements) against the thruster specifications (bar charts). The height of the bar chart can be compared against the desired fuel mass needed, at the thruster’s specific impulse values (Isp, units in seconds). In other words, for each thruster’s Isp value, if the height of the bar chart (which represents the max fuel mass for that thruster, at that Isp) exceeds the fuel mass requirements of your mission at that particular Isp, then that thruster can satisfy your mission lifetime requirements.
Note
The native “Sam’s Simulator” uses the US Standard Atmosphere 1976 as the atmospheric density model as a look-up table of coefficients in an exponential function (for speed), while the STK Mode uses the Jacchia Roberts atmospheric density model. Also, the native mode uses an approximated orbit decay model while STK Mode performs a full orbit propagation for all 6 states. Thus, running ORBITM with STK makes computation very much slower, and the ∆V values in both modes would differ, although in most cases they are close (and definitely in the same order of magnitude).